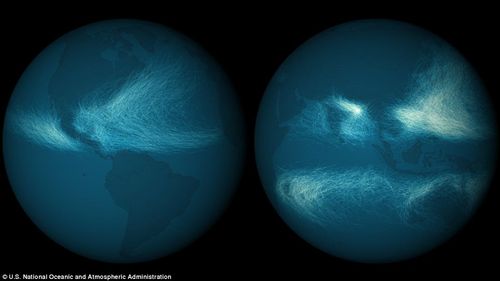
Created by the U.S. National Oceanic and Atmospheric Administration, this stunning image charts the nearly 12,000 tropical cyclones that have occurred across the globe since the NOAA began keeping a record in 1842. The team used colors to help show patterns in the density of storms affecting a given area.
The group also produced a second map showing storm intensity and an interactive map that allows you to track individual strom paths throughout history.


